
Rolling functions are widely used in science, especially when working with smoothing and/or time series. They also form the basis of feature extraction from time series, used for many classification methods in machine learning. Simply put, they take a window of k values at a time and perform some mathematical operation on them. When I started out using rolling functions for smoothing animal movement paths, I used zoo’s rollmean(). With large data sets, this step always took a long time. Only much later did I realise that many packages exist that tackle this issue. I’ve used a number of them in my work, but now I decided to put them to the test! Which package is fastest?! Of course it’s a little more nuanced than that: There are many different types of rolling functions, and extra functionality that one might need. Although we try to narrow the tests to avoid them getting out of hand, it does mean it will be a long post with lots of numbers, but hopefully it will prove useful for both you and me. :-)
Which functions?
Rolling functions can in principle be used with any function that produces a single value from a vector (see custom functions below). But some are common and have their own functions with optimised algorithms have been developed for them. We are considering the following computations:
- Mean
- Median
- Min
- Max
- Sum
- Product (TODO)
- SD
- MAD (TODO)
- Correlation (TODO)
- Covariance (TODO)
- Skew (TODO)
- Custom functions
Which features?
There are a lot of features available in many of the packages. It is outside the scope of this benchmark to test them all, as we will just test with standard settings, but do check out some of the packages that have more advanced features. For now, the two most important features are:
NA handling. The standard should be to have a constant window width, and if NAs are present to (1) exclude the NAs and compute the metric from the remaining values, or (2) return NA. This distinction is often reflected in a parameter called complete or something similar. Although are more ways to deal with this, e.g. adaptive window widths.
Alignment. Alignment is one of the most important features of a rolling function. There are (at least) three ways they can be aligned:
- Left: [*——], will cause the returned vector to have NA values at the right end.
- Center: [—*—], will cause the returned vector to have NA values at either end.
- Right: [——*], will cause the returned vector to have NA values at the left end.
Which packages?
There are quite a lot of packages that have written functions for this; not all packages have functions for each metric. Here are the packages under consideration (if you have additions, please open an issue on Github):
| Package name | Comment | Installation |
|---|---|---|
| data.table | Installed from the rollingmedian branch on Github |
devtools::install_github("Rdatatable/data.table", ref = "rollmedian") |
| RcppRoll | renv::install("RcppRoll") |
|
| roll | Installed from Github | devtools::install_github("jasonjfoster/roll") |
| RollingWindow | Installed from Github | devtools::install_github("andrewuhl/RollingWindow") |
| runner | renv::install("runner") |
|
| runstats | Requires additional installation of lib3
|
renv::install("runstats") |
| slider | renv::install("slider") |
|
| zoo | renv::install("zoo") |
Notes: Because the test has to run on a normal vector in memory, I am not including {polars}. If it is possible to run rolling functions in memory with {polars}, please leave a comment below or raise an issue.
Benchmarks
The rules
Let’s start by setting up some ground rules; mostly to rear in all the potential scenarios I could try to cover, but also to save some computation time.
- Test on a 1.000.000 element vector
- Vector is right-aligned
- Output vector same length as input vector
- If
NAs are present, returnNA - Default window width (51)
- (TODO Range of window widths to assess scaling)
Let’s get started! First we’ll import all the packages we need. I use the microbenchmark package for the tests and ggplot2 for some graphs of the results.
Set variables
For the benchmark we’ll make a vector of a million values, all drawn from a Gaussian distribution (doesn’t really matter where there come from), but the important thing is that they are floating numbers, not integers. Initially we’ll set the window width to 51 - the width needs to be an uneven number. And we set the number of times to run each test to 10.
Just making the plotting functions here
library(scales)
library(ggdist)
library(paletteer)
library(patchwork)

plot_benchmark_single <- function(microbenchmark_output, width){

  df <- microbenchmark_output |>
    ungroup() |>
    dplyr::filter(.data$window_width > width) |>
      separate_wider_delim(expr, delim = "::", names = c("package_name", "function_name")) |>
      mutate(time = time / 1000000,
             pkg_fct = paste(package_name, function_name, sep = " "))

  med_time <- df |>
    group_by(pkg_fct) |>
    summarise(time = round(median(time), 2)) |>
    mutate(time = paste(time, "ms"))

  df |>
    ggplot(aes(x = fct_reorder(pkg_fct, time, .desc = TRUE), y = time, fill = pkg_fct)) +
    # ggdist::stat_interval() +
    # geom_boxplot(outliers = FALSE) +
    ggdist::geom_weave(position = "dodge", alpha = 0.5) +
    # geom_jitter(height = 0, width = 0.1, alpha = 0.3) +
    geom_text(data = med_time, aes(x = pkg_fct, y = Inf, label = time), hjust = 1) +
    scale_y_log10(breaks=trans_breaks("log10", function(x) 10^x, n=4)) +
    scale_x_discrete(labels = label_wrap(10)) +
    annotation_logticks(sides = "b", colour = "grey70") +
    guides(fill = "none") +
    coord_flip() +
    ylab("Time (ms)") +
    xlab("") +
    ggdist::theme_ggdist() +
    theme(
      panel.grid.major.x = element_line(colour = "grey70"),
      panel.grid.minor.x = element_line(colour = "grey90"),
      text = element_text('mono')
    )
}

plot_benchmark_multi <- function(microbenchmark_output){

  microbenchmark_output <- microbenchmark_output |>
      separate_wider_delim(expr, delim = "::", names = c("package_name", "function_name")) |>
      mutate(time = time / 1000000,
             pkg_fct = paste(package_name, function_name, sep = " "))

  med_time <- microbenchmark_output |>
    group_by(pkg_fct, window_width) |>
    filter(window_width == 101) |>
    summarise(time = round(median(time), 2)) |>
    mutate(time = paste(time, "ms"))

  microbenchmark_output |>
    ggplot(aes(x = fct_reorder(pkg_fct, time, .desc = TRUE), y = time, color = factor(window_width))) +
    stat_interval(aes(color_ramp = after_stat(level)), position = "dodge", .width = c(0.25, 0.5, 0.8, 0.95)) +
    geom_text(
      data = med_time,
      aes(x = pkg_fct, y = Inf, label = time),
      hjust = 1,
      show.legend = FALSE
      ) +
    scale_y_log10(breaks=trans_breaks("log10", function(x) 10^x, n=4)) +
    scale_x_discrete(labels = label_wrap(10)) +
    scale_colour_paletteer_d("ltc::trio3", direction = -1) +
    coord_flip() +
    ylab("Time (ms)") +
    guides(colour = guide_legend("Window width (n)"),
           color_ramp = guide_legend("Probability intervals")
           ) +
    xlab("") +
    ggdist::theme_ggdist() +
    theme(
      panel.grid.major.x = element_line(colour = "grey70"),
      panel.grid.minor.x = element_line(colour = "grey90"),
      text = element_text('mono')
    )
}

plot_benchmark <- function(microbenchmark_output, ref_width, title){
  a <- plot_benchmark_multi(microbenchmark_output)
  # b <- plot_benchmark_single(microbenchmark_output, ref_width)
  # (a / b)
  a + plot_annotation(title = paste("<strong>Benchmark for: Rolling", title, "</strong>"),
                            subtitle = "We test the speed and scaling. We use window sizes of <span style='color:#009E73FF;'><strong>11</strong></span>, <span style='color:#56B4E9FF;'><strong>101</strong></span> and <span style='color:#E69F00FF;'><strong>1001</strong></span>. <br>To the right is the **median** time for the <span style='color:#56B4E9FF;'><strong>101</strong></span> window.",
                            theme = theme(text = element_text('mono'),
                                          plot.title = ggtext::element_markdown(lineheight = 1.1),
                                          plot.subtitle = ggtext::element_markdown(lineheight = 1.1)
                                          )
                      )
}
Mean
Benchmarking code
bm_mean <- data.frame()

for (n in window_widths){
  bm_mean <- microbenchmark(
    "data.table::frollmean" = data.table::frollmean(df$x, n, align = "right"),
    "roll::roll_mean" = roll::roll_mean(df$x, width = n),
    "RollingWindow::RollingMean" = RollingWindow::RollingMean(df$x, n),
    "runstats::RunningMean" = runstats::RunningMean(df$x, W = n),
    "slider::slide_mean" = slider::slide_mean(df$x, before = n-1, complete = TRUE),
    "RcppRoll::roll_meanr" = RcppRoll::roll_meanr(df$x, n = n, fill = NA),
    "zoo::rollmeanr" = zoo::rollmeanr(df$x, k = n, fill = NA),
    "runner::mean_run" = runner::mean_run(df$x, k = n, na_pad = TRUE),
    times = n_times) |>
    mutate(window_width = n) |>
    bind_rows(bm_mean)
}

bm_mean |>
  plot_benchmark(101, "mean")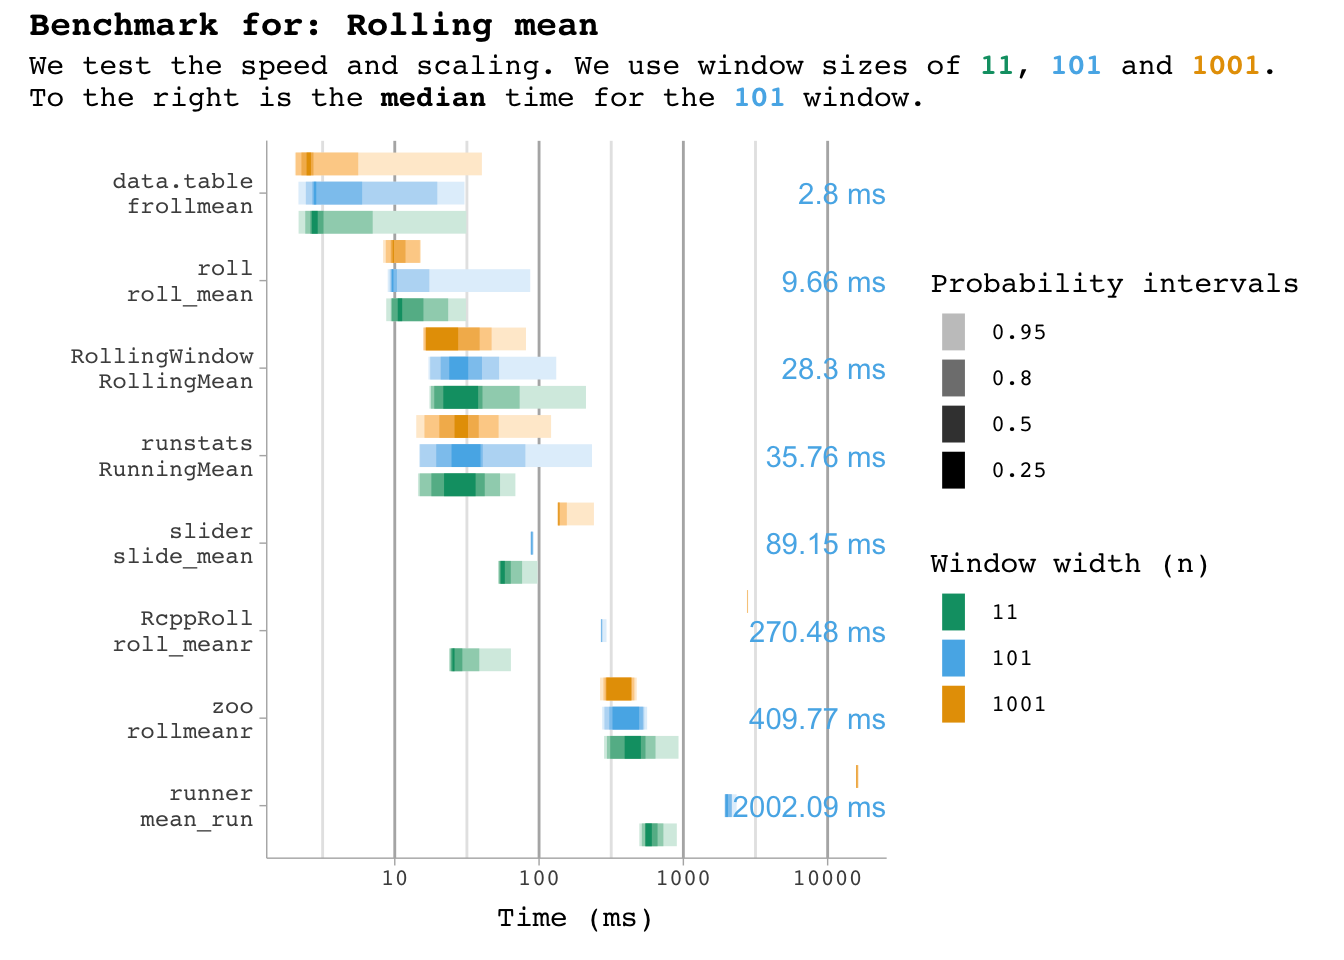
Median
Benchmarking code
bm_median <- data.frame()

for (n in window_widths){
  bm_median <- microbenchmark(
    "data.table::frollmedian" = data.table::frollmedian(df$x, n),
    "RcppRoll::roll_median" = RcppRoll::roll_median(df$x, n = n, fill = NA),
    "roll::roll_median" = roll::roll_median(df$x, width = n),
    "RollingWindow::RollingMedian" = RollingWindow::RollingMedian(df$x, n),
    "zoo::rollmedianr" = zoo::rollmedianr(df$x, k = n, fill = NA),
    times = n_times) |>
    mutate(window_width = n) |>
    bind_rows(bm_median)
}

bm_median |>
  plot_benchmark(101, "median")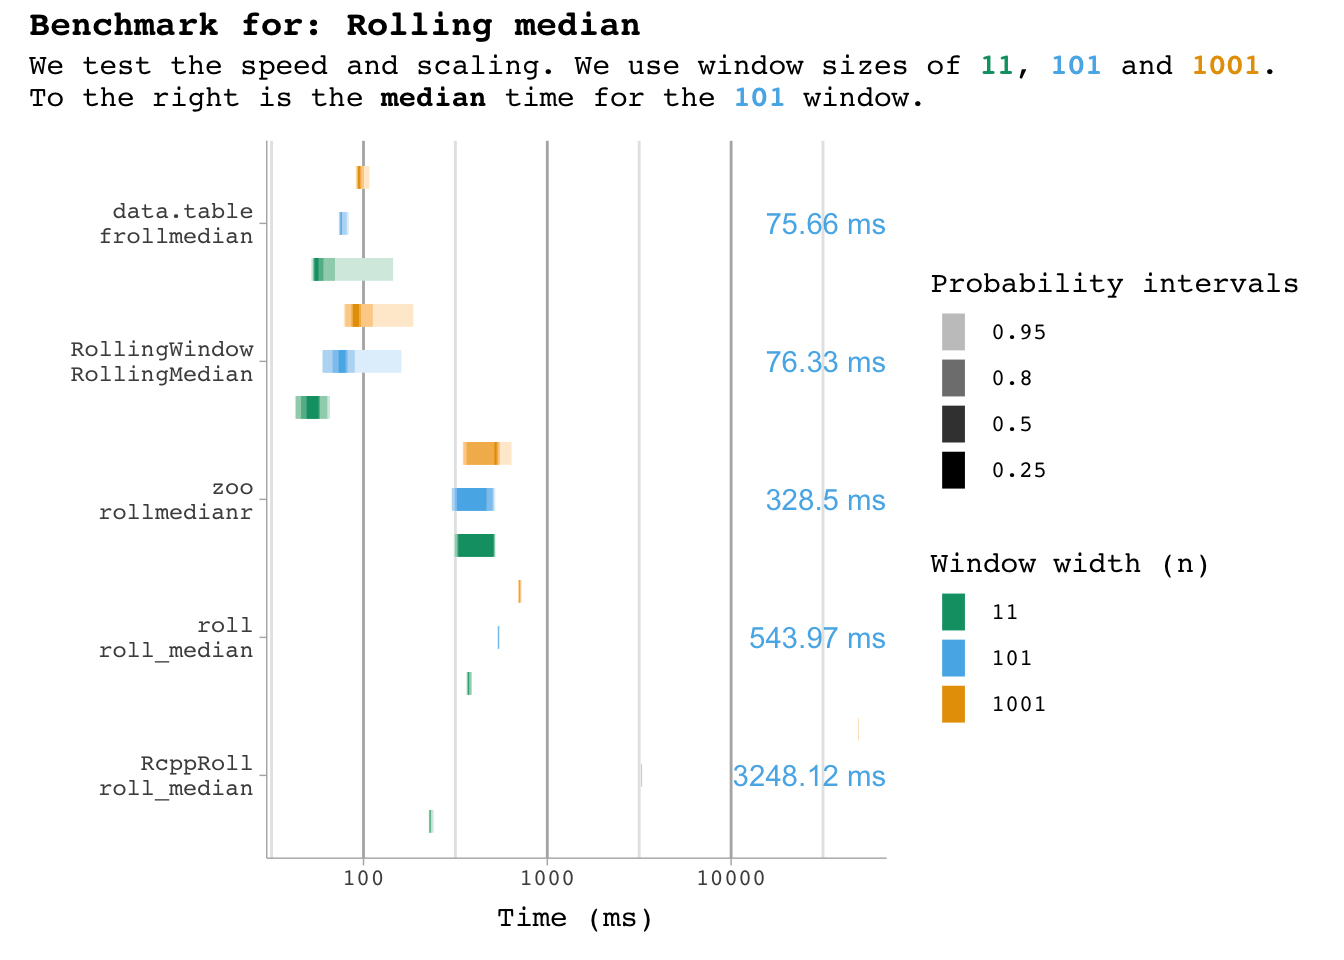
Min
Benchmarking code
bm_min <- data.frame()

for (n in window_widths){
  bm_min <- microbenchmark(
    "data.table::frollmin" = data.table::frollmin(df$x, n),
    "RcppRoll::roll_min" = RcppRoll::roll_min(df$x, n = n, fill = NA),
    "roll::roll_min" = roll::roll_min(df$x, width = n),
    "RollingWindow::RollingMin" = RollingWindow::RollingMin(df$x, n),
    "slider::slide_min" = slider::slide_min(df$x, before = n-1, complete = TRUE),
    "runner::min_run" = runner::min_run(df$x, k = n, na_pad = TRUE),
    times = n_times) |>
    mutate(window_width = n) |>
    bind_rows(bm_min)
}

bm_min |>
  plot_benchmark(101, "min")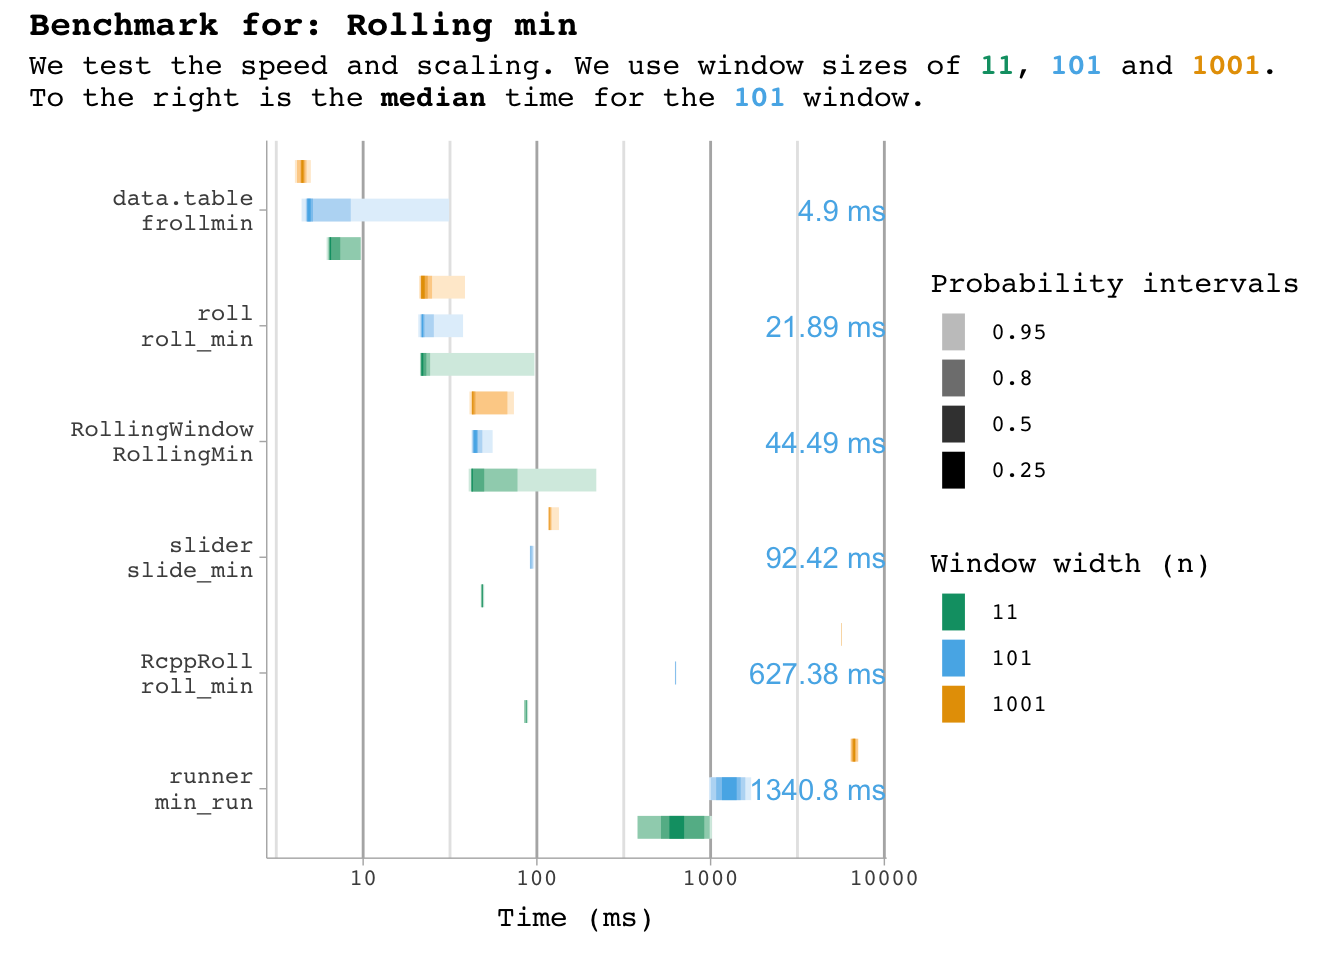
Max
Benchmarking code
bm_max <- data.frame()

for (n in window_widths){
  bm_max <- microbenchmark(
    "data.table::frollmax" = data.table::frollmax(df$x, n),
    "RcppRoll::roll_max" = RcppRoll::roll_max(df$x, n = n, fill = NA),
    "roll::roll_max" = roll::roll_max(df$x, width = n),
    "RollingWindow::RollingMax" = RollingWindow::RollingMax(df$x, n),
    "runner::max_run" = runner::max_run(df$x, k = n, na_pad = TRUE),
    "slider::slide_max" = slider::slide_max(df$x, before = n-1, complete = TRUE),
    "zoo::rollmax" = zoo::rollmax(df$x, k = n, fill = NA),
    times = n_times) |>
    mutate(window_width = n) |>
    bind_rows(bm_max)
}

bm_max |>
  plot_benchmark(101, "max")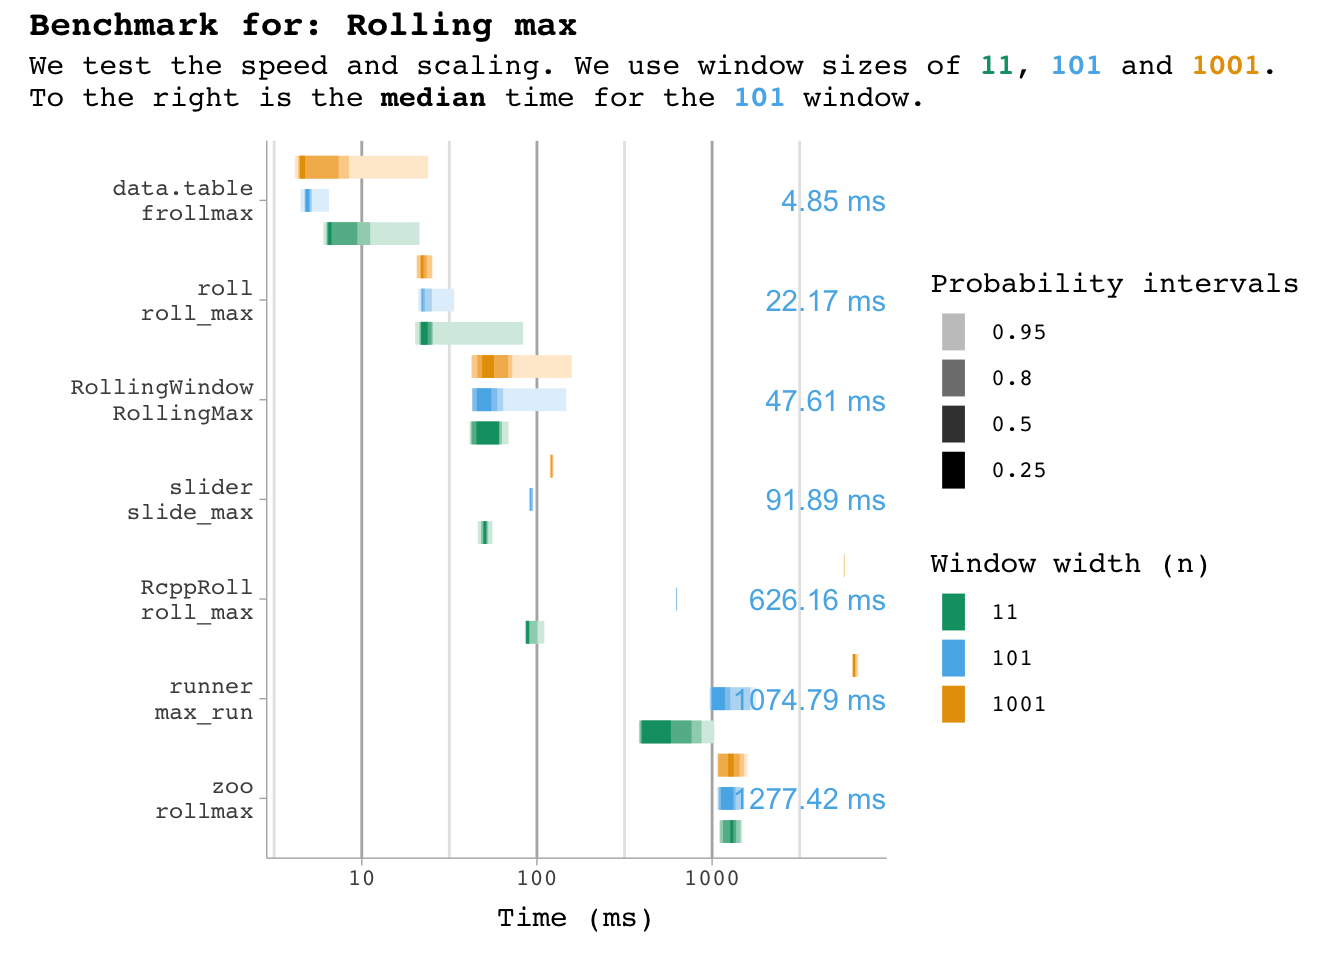
Sum
Benchmarking code
bm_sum <- data.frame()

for (n in window_widths){
bm_sum <- microbenchmark(
    "data.table::frollsum, exact" = data.table::frollsum(df$x, n, algo = "exact"),
    "data.table::frollsum, fast" = data.table::frollsum(df$x, n, algo = "fast"),
    "RcppRoll::roll_sum" = RcppRoll::roll_sum(df$x, n = n, fill = NA),
    "roll::roll_sum" = roll::roll_sum(df$x, width = n),
    "RollingWindow::RollingSum" = RollingWindow::RollingSum(df$x, n),
    "runner::sum_run" = runner::sum_run(df$x, k = n, na_pad = TRUE),
    "slider::slide_sum" = slider::slide_sum(df$x, before = n-1, complete = TRUE),
    "zoo::rollsum" = zoo::rollsum(df$x, n, fill = NA),
    times = n_times) |>
    mutate(window_width = n) |>
    bind_rows(bm_sum)
}

bm_sum |>
  plot_benchmark(101, "sum")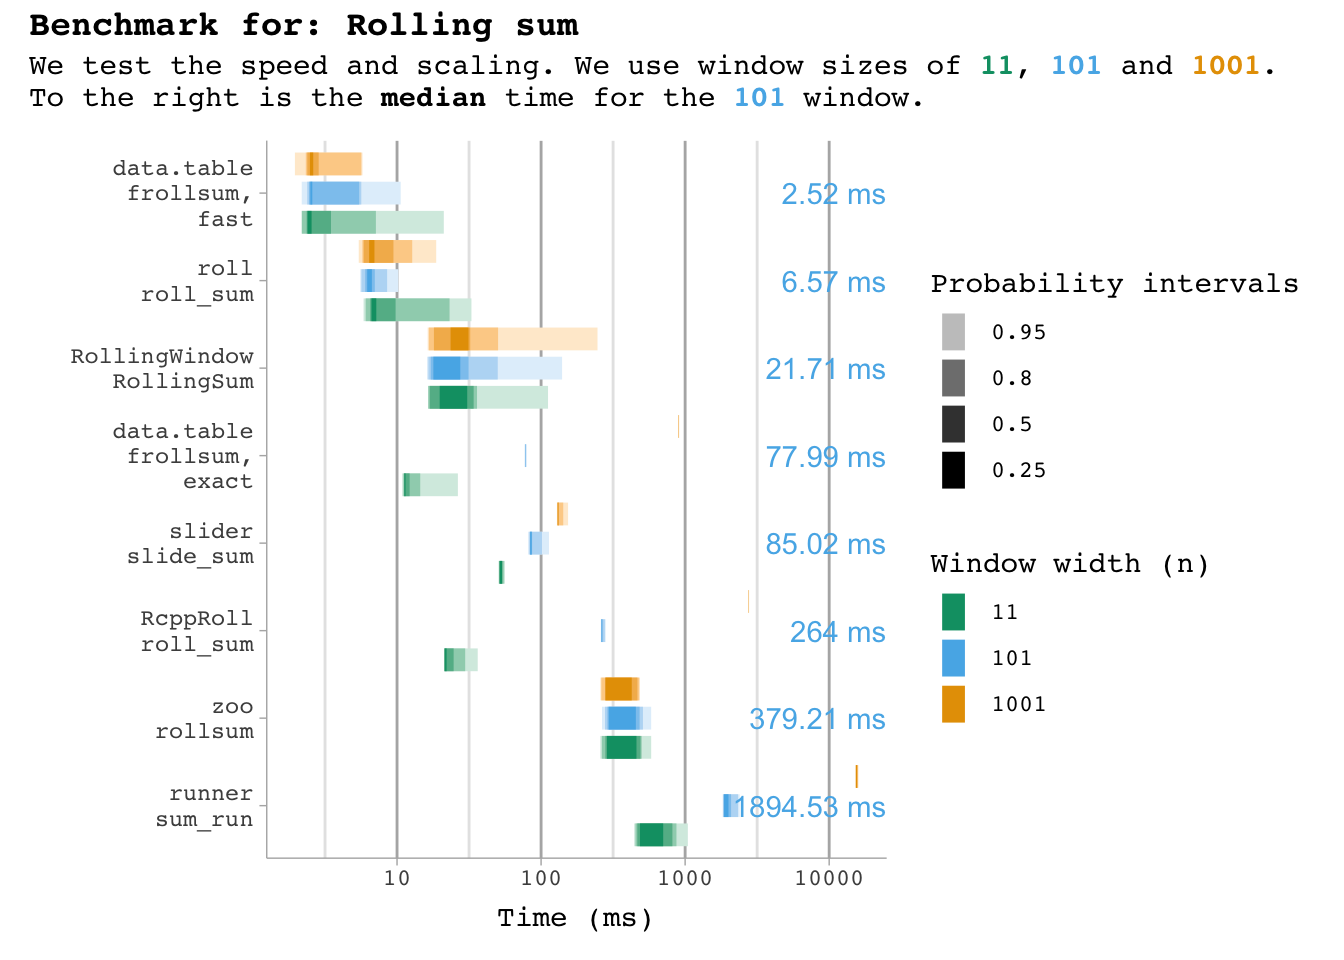
SD
Benchmarking code
bm_sd <- data.frame()

for (n in window_widths){
bm_sd <- microbenchmark(
  "RcppRoll::roll_sd" = RcppRoll::roll_sd(df$x, n = n, fill = NA),
  "roll::roll_sd" = roll::roll_sd(df$x, width = n),
  "RollingWindow::RollingStd" = RollingWindow::RollingStd(df$x, n),
  "runstats::RunningSd" = runstats::RunningSd(df$x, W = n),
  times = n_times) |>
    mutate(window_width = n) |>
    bind_rows(bm_sd)
}

bm_sd |>
  plot_benchmark(101, "sd")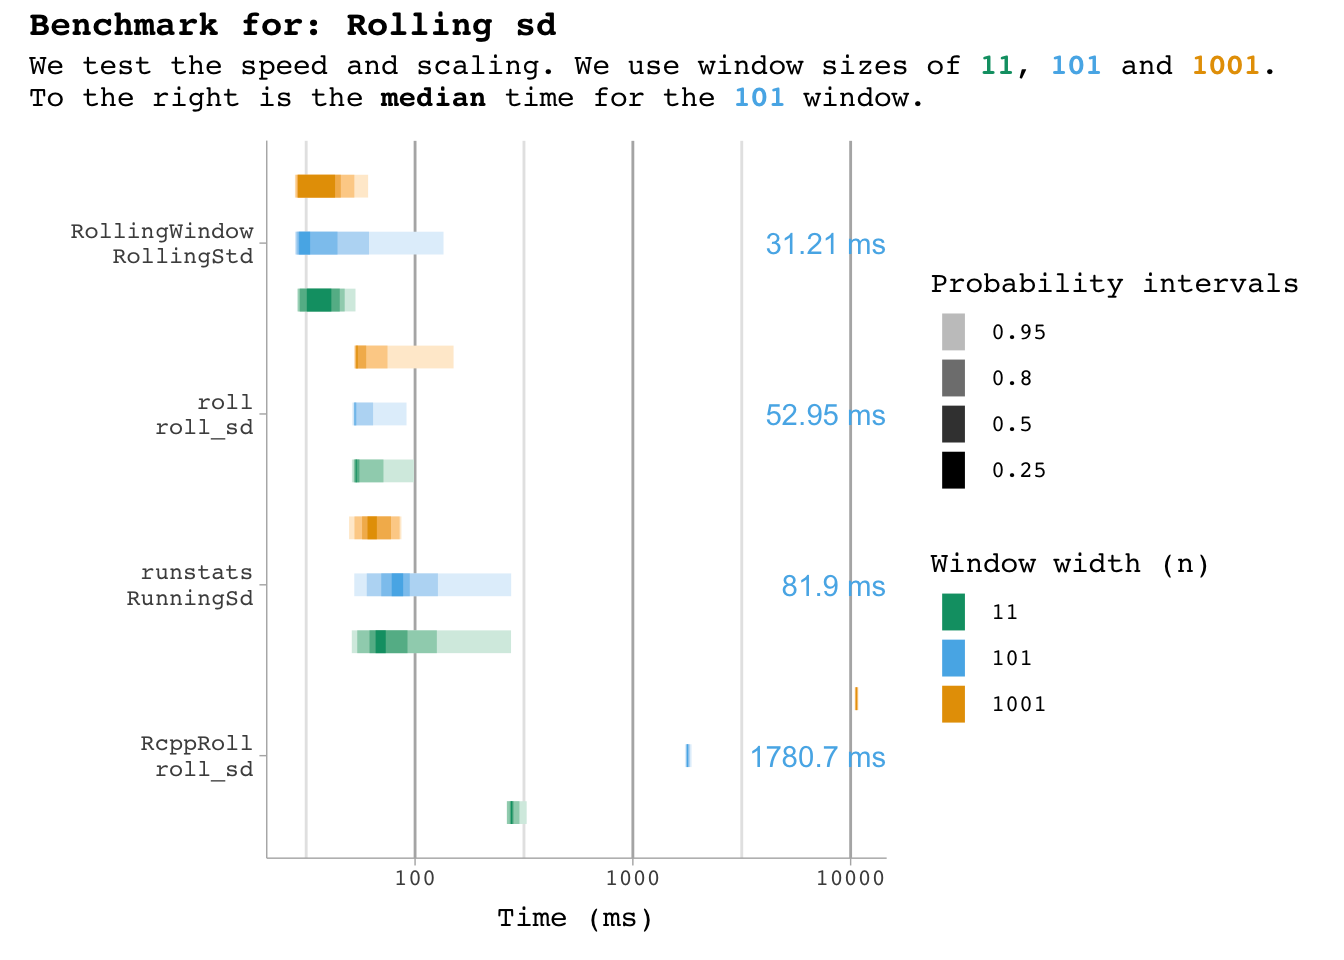
Custom functions
These functions are not optimised like the others, so they take a lot longer… so I’ll use fewer iterations here. To test it, I’ve simply implemented a sum_custom function that is not optimised.
Benchmarking code
bm_custom <- data.frame()

sum_custom <- function(v){
  s <- 0
  for (i in v){
    s <- s+i
  }
}

for (n in window_widths){
bm_custom <- microbenchmark(
  "data.table::frollapply" = data.table::frollapply(df$x, n, sum_custom),
  "zoo::rollapply" = zoo::rollapply(df$x, n, sum_custom),
  times = 5) |>
    mutate(window_width = n) |>
    bind_rows(bm_custom)
}

bm_custom |>
  plot_benchmark(101, "custom function")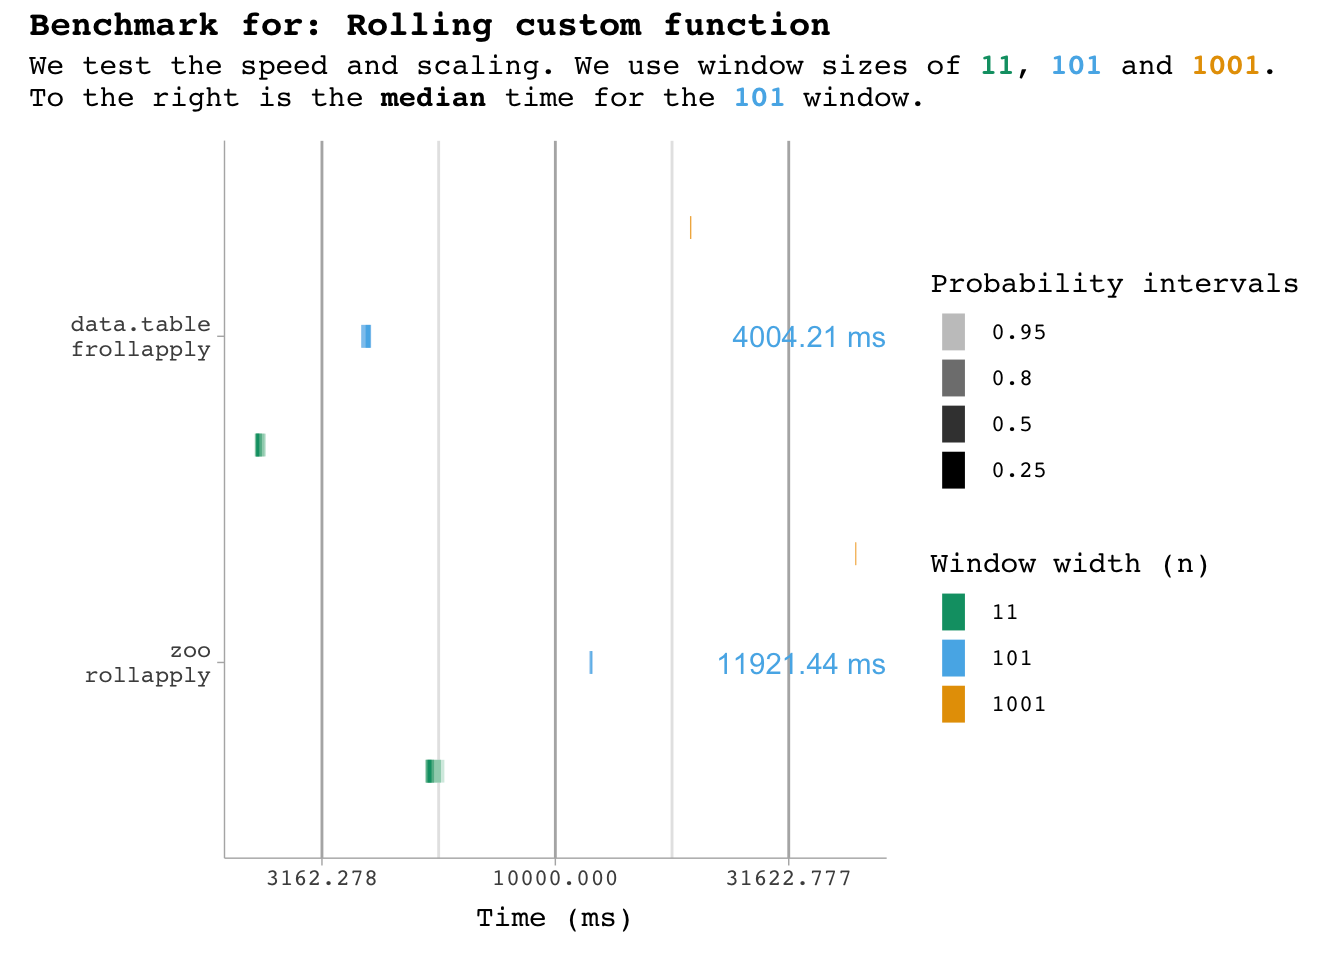
Conclusion
In conclusion there’s a clear overall winner: data.table. It’s fast, flexible, it’s well-maintain and it’s thoroughly tested. However, there are a few cases where you might want something different.
- If you need rolling functions that data.table doesn’t have, I would go with roll which covers a range of other functions.
- If you need weighted estimates, I would go with roll.
- If you need custom alignment (not right/left/center), I would go with slider.
And if you can in any way get away with it: Do not use custom functions! See if it might not be better to compute the constituents from optimised functions.
Citation
@online{roald-arbøl2024,
  author = {Roald-Arbøl, Mikkel},
  title = {Benchmarking Rolling Window Functions in {R}},
  date = {2024-10-03},
  url = {https://roald-arboel.com/blog/posts/2024/10/03/Benchmark-rolling/},
  langid = {en}
}